


Using Heat Mapping To Build And Design A Strategic Website

September 15, 2020
When someone asks if they are ‘hot or cold’ in relation to finding an item, hot would indicate they are close and cold means they are way off. That same analogy can translate into many digital analytical tools because it can tell business owners if their strategy is working or needs some fine-tuning. Heat mapping is one such tool that can give you a better understanding of your website performance.
In today’s post, we are going to delve into using heat mapping to build and design a strategic website so that you can gain a better understanding of this important tool.
 The best way to explain a website heat map is to look out how heat mapping is used for other purposes. For example, it can be used to show thermal energy leaving your home to see where the heat is escaping. This would usually show reds and oranges around your windows, and blues and greens around your walls where the heat loss is not as prevalent.
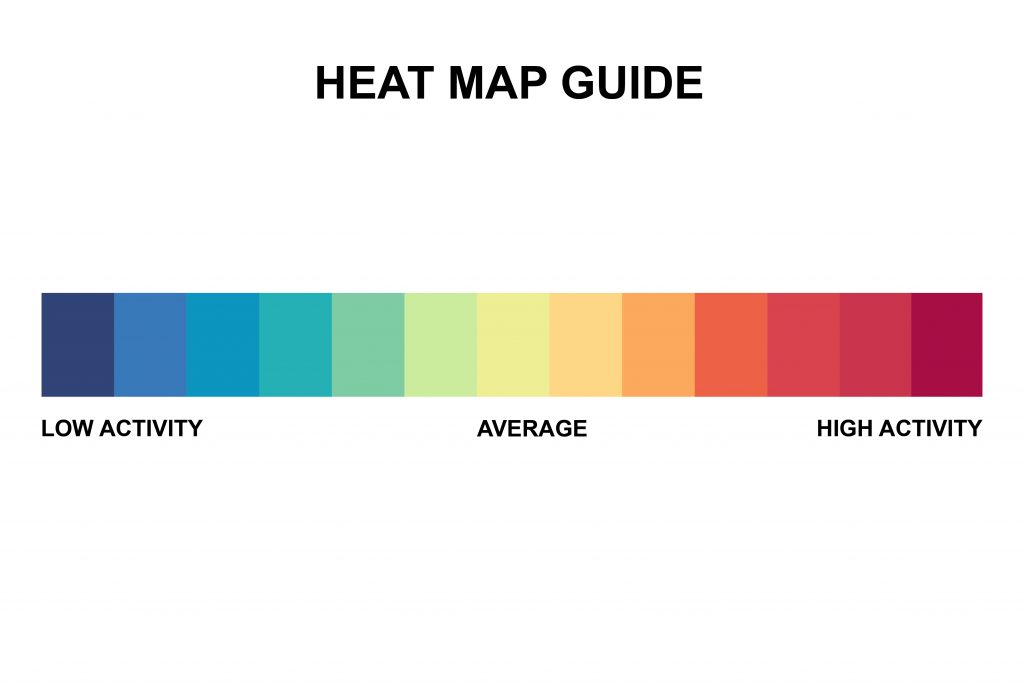
When it comes to website heat mapping, the same ethos applies only it is tracking the areas of the page people are interacting with the most. Areas of high traffic are going to show up in brighter colours, and places that don’t get as much attention will give off cooler colours. It’s possible to access a heat map by using analytical tools which will monitor how your website visitors are interacting with your page. +
The best way to explain a website heat map is to look out how heat mapping is used for other purposes. For example, it can be used to show thermal energy leaving your home to see where the heat is escaping. This would usually show reds and oranges around your windows, and blues and greens around your walls where the heat loss is not as prevalent.
When it comes to website heat mapping, the same ethos applies only it is tracking the areas of the page people are interacting with the most. Areas of high traffic are going to show up in brighter colours, and places that don’t get as much attention will give off cooler colours. It’s possible to access a heat map by using analytical tools which will monitor how your website visitors are interacting with your page. +
 If you imagine a physical retail space there are going to be areas of the store that are very busy, meaning the items in these areas are more likely to sell. Then you have the quiet patches at the back where nobody ever ventures into. If the manager notices a particular item isn’t selling, they’d naturally move these items into the more populated areas, or draw attention to them with signage. But with a digital app or website, this just isn’t possible given you can’t physically see where people are hovering over the most.
For your website to be truly functional, you need to make sure the right elements are attracting the right attention. There could be elements of your web design that are glitching or lead to broken links. Sometimes it’s even ads in the wrong place meaning they are getting all the clicks instead of your content. All of these issues can be picked up because you can see where the problem is. Only when you have a logical pattern of activity on your website will it work as intended. When it comes to building and designing a strategic website, this is key.
If you imagine a physical retail space there are going to be areas of the store that are very busy, meaning the items in these areas are more likely to sell. Then you have the quiet patches at the back where nobody ever ventures into. If the manager notices a particular item isn’t selling, they’d naturally move these items into the more populated areas, or draw attention to them with signage. But with a digital app or website, this just isn’t possible given you can’t physically see where people are hovering over the most.
For your website to be truly functional, you need to make sure the right elements are attracting the right attention. There could be elements of your web design that are glitching or lead to broken links. Sometimes it’s even ads in the wrong place meaning they are getting all the clicks instead of your content. All of these issues can be picked up because you can see where the problem is. Only when you have a logical pattern of activity on your website will it work as intended. When it comes to building and designing a strategic website, this is key.
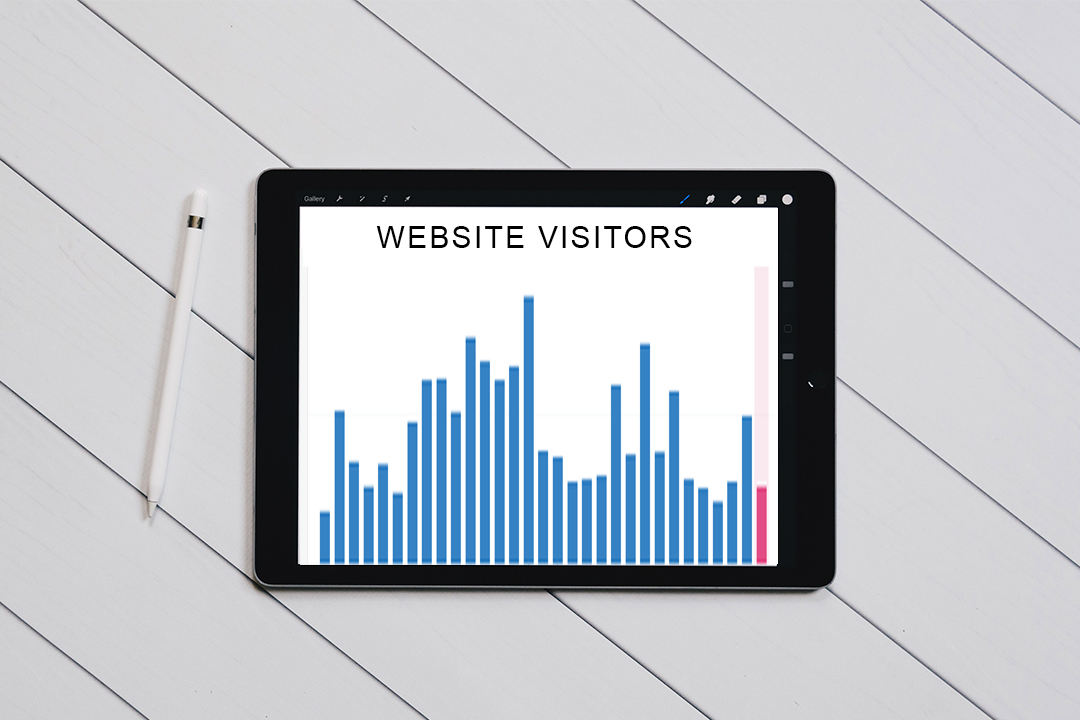 Website visitor stats are important because they will tell you things such as how many website visitors you had that day. They can even tell you what time your website gets the most visitors at and where they are located. However, even with individual page metrics counting up the visitors, this still won’t tell you what they are doing on your website. Or why the bounce rate is so high on a particular page, why you aren’t getting many sales etc.
Knowledge is power and this is certainly true in the marketing stakes. By combining your regular visitor stats with heat mapping you can build an even broader picture of your website’s performance. You won’t just know how many visitors you had on a particular day, you’ll know where their mouse naturally gravitated towards. If you’ve just updated your website and are trying to figure out if the new setup is working, heat mapping is even more important.
Website visitor stats are important because they will tell you things such as how many website visitors you had that day. They can even tell you what time your website gets the most visitors at and where they are located. However, even with individual page metrics counting up the visitors, this still won’t tell you what they are doing on your website. Or why the bounce rate is so high on a particular page, why you aren’t getting many sales etc.
Knowledge is power and this is certainly true in the marketing stakes. By combining your regular visitor stats with heat mapping you can build an even broader picture of your website’s performance. You won’t just know how many visitors you had on a particular day, you’ll know where their mouse naturally gravitated towards. If you’ve just updated your website and are trying to figure out if the new setup is working, heat mapping is even more important.
What Is Heat Mapping?
The best way to explain a website heat map is to look out how heat mapping is used for other purposes. For example, it can be used to show thermal energy leaving your home to see where the heat is escaping. This would usually show reds and oranges around your windows, and blues and greens around your walls where the heat loss is not as prevalent.
When it comes to website heat mapping, the same ethos applies only it is tracking the areas of the page people are interacting with the most. Areas of high traffic are going to show up in brighter colours, and places that don’t get as much attention will give off cooler colours. It’s possible to access a heat map by using analytical tools which will monitor how your website visitors are interacting with your page. +
Interpreting Your Heat Map Data
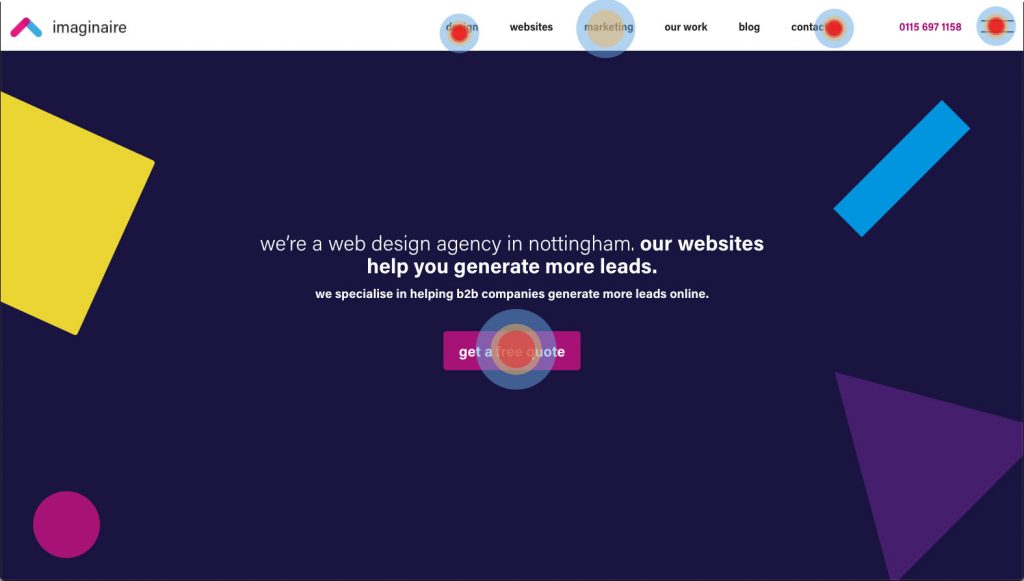
Using website heat maps, businesses can track user behaviour and discover actionable insights that help them make changes to improve their conversion rates. As mentioned, the warm colours on your website heatmap signify where people are clicking the most. It’s of course not going to be the case that your entire website will show only red, because a web page contains many possible functions. However, the key is to make sure the red is in the right areas. Taking e-commerce as an example, you’d naturally want reds over ‘buy now’ buttons or the areas where people can browse through your products. Heat mapping will ultimately allow you to validate your existing website design and make changes where necessary. It takes the guessing game out of ‘what is wrong with my website?’ because you can see where people are spending the most time, and what is being ignored. Whether it’s a broken link, poor colour scheme or even a lack of responsiveness, you can build a more insightful picture with heat mapping, especially compared with simply looking at how many visitors your website gets. After all, you know you have visitors, but what are they doing while on your website? Heat mapping will reveal all.Why Is Heat Mapping Important?
If you imagine a physical retail space there are going to be areas of the store that are very busy, meaning the items in these areas are more likely to sell. Then you have the quiet patches at the back where nobody ever ventures into. If the manager notices a particular item isn’t selling, they’d naturally move these items into the more populated areas, or draw attention to them with signage. But with a digital app or website, this just isn’t possible given you can’t physically see where people are hovering over the most.
For your website to be truly functional, you need to make sure the right elements are attracting the right attention. There could be elements of your web design that are glitching or lead to broken links. Sometimes it’s even ads in the wrong place meaning they are getting all the clicks instead of your content. All of these issues can be picked up because you can see where the problem is. Only when you have a logical pattern of activity on your website will it work as intended. When it comes to building and designing a strategic website, this is key.
Can’t I Just Use My Regular Visitor Stats?
Website visitor stats are important because they will tell you things such as how many website visitors you had that day. They can even tell you what time your website gets the most visitors at and where they are located. However, even with individual page metrics counting up the visitors, this still won’t tell you what they are doing on your website. Or why the bounce rate is so high on a particular page, why you aren’t getting many sales etc.
Knowledge is power and this is certainly true in the marketing stakes. By combining your regular visitor stats with heat mapping you can build an even broader picture of your website’s performance. You won’t just know how many visitors you had on a particular day, you’ll know where their mouse naturally gravitated towards. If you’ve just updated your website and are trying to figure out if the new setup is working, heat mapping is even more important.